Non-ticketed cricket festivals are no longer just “nice-to-have” fan extras around a big match. When they’re designed with movement analytics, they become commercial and community growth engines that can lift attendance, extend dwell time, improve vendor revenue, and make the whole matchday feel more premium. That’s the big lesson from examples like Craft Revival and Wonders of Winter: when you can see how people move, where they pause, and what they miss, you can turn a loose crowd into a high-performing experience. In cricket, that means better fan festivals, smarter cricket activations, and more confident decisions about event layout, staffing, and vendor optimization.
This guide is built for venue operators, event managers, sponsors, local councils, and cricket businesses that want to turn foot traffic into measurable value. It also reflects a broader shift toward evidence-based planning, the same mindset seen across sectors in ActiveXchange case studies, where leaders use movement intelligence to move from gut feel to data-informed decisions. If you’ve been looking for a practical playbook for movement analytics in sports environments, this is it.
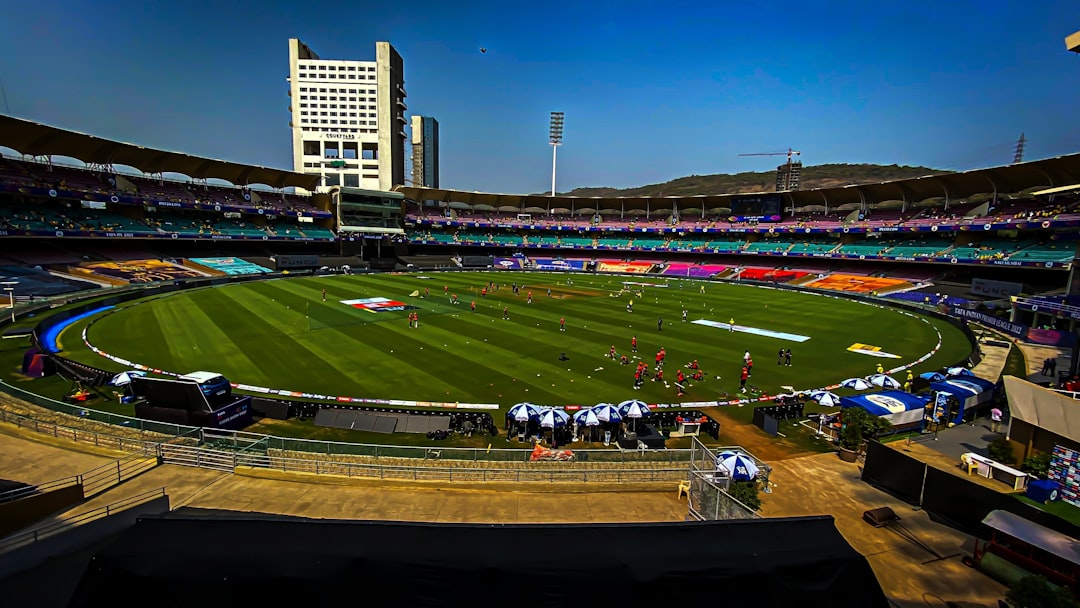
Why Non-Ticketed Cricket Festivals Need a Different Operating Model
They are open systems, not controlled gates
Ticketed events are easier to forecast because you know who is inside, when they arrive, and how long they stay. Non-ticketed events, by contrast, behave like open systems: families drift in and out, casual fans arrive at different times, and external factors like weather, public transport, and nearby attractions reshape the crowd hour by hour. That makes traditional planning methods weak unless you have a live view of movement patterns, queue pressure, and cluster density.
This is why cricket fan zones and festival-style activations need the same level of operational discipline as a stadium bowl. A crowd in a fan festival may be free to enter, but it still has choices, and every choice has a revenue consequence. If visitors skip a food lane, miss a sponsor activation, or leave before the second wave of programming, the event leaves money on the table. For operators who want to sharpen forecasting and decision-making, the logic behind evidence-based decision making is directly relevant.
Movement is the hidden currency of fan experience
At open-access cricket events, movement is the true signal of engagement. A person standing near a giant screen for 18 minutes is not just “present”; they are likely interested, receptive to buying food, and open to brand touchpoints. A family that walks past the same merchandise stall three times before buying is creating a valuable behavioral trail. When you capture those trails, you can redesign the environment to support conversion, not just attendance.
This is where examples such as Craft Revival and Wonders of Winter matter. ActiveXchange highlights how non-ticketed events like Craft Revival can be assessed for tourism value, while Wonders of Winter uses movement data to understand audience reach and annual growth. In cricket terms, these are the same questions event teams should ask: who came, how far did they travel, where did they spend time, and which zones actually converted attention into action?
Growth comes from repeatable patterns, not one-off spikes
Many festival teams celebrate a big attendance headline and stop there. But growth engines are built on repeatable patterns: the right entry points, the right density around food and entertainment, the right staffing levels at peak drift times, and the right vendor placement to turn pass-by traffic into revenue. If you can model those patterns across multiple matches or tour events, you can improve the next activation instead of reinventing it from scratch.
That approach mirrors how sports and community organizations use data to strengthen planning across seasons, not just on the day. The same way a venue would study a matchday schedule and learn from it, organizers can build a longer-term playbook that improves every festival iteration. For more on structured event-facing content strategies, see where to watch and eat for major events and how audience intent changes when social spaces are layered into the experience.
What Movement Analytics Actually Measures at Cricket Festivals
Density, dwell time, and directional flow
Movement analytics typically tracks where people enter, how they circulate, where they stop, how long they stay, and how they exit. In a cricket festival setting, those signals reveal whether a sponsor zone is drawing people in, whether the kids’ activity area is absorbing families too effectively, or whether a food lane is creating an accidental bottleneck. This kind of insight is far more useful than raw attendance because it exposes the reasons behind behavior, not just the count.
For example, if a merchandise kiosk is placed near a low-traffic edge, it may look “available” on the map but still underperform because it doesn’t benefit from natural flow. Likewise, if a stage is positioned so that sound and sightlines clash with the main traffic artery, it may create congestion without creating value. Movement data lets you observe these friction points in a way that mirrors how organizations use Movement Data to understand the role of recreation infrastructure in community outcomes.
Origin-destination behavior and zone conversion
The most powerful movement insights come from understanding origin-destination paths: where people come from, what they visit first, what they visit next, and what they skip entirely. In a cricket fan festival, this tells you if the crowd is behaving like “food-first visitors,” “family-zone visitors,” or “screen-first visitors.” Once you know those segments, you can design the site to improve conversion between zones.
A practical example: if many visitors enter through one side but most vendors are clustered at the opposite end, the event is asking people to make an extra journey before they’ve formed attachment to the space. That can depress spending, especially for casual attendees. With movement analytics, you can place early “hook” assets closer to arrival points and save the deeper zones for high-intent programming. If you’re building a data-led view of audience behavior, this principle is similar to how tourism value determination works at non-ticketed events.
Revisit rate and audience stickiness
Not every visitor needs to spend money immediately for the event to succeed. Some of the most valuable signals are revisit rate and stickiness: do people leave a zone and then come back later, or do they bounce out after a short look? Revisit behavior often signals trust, comfort, and content relevance. In event terms, that means a zone is doing its job as a destination rather than just a corridor.
Cricket activations often underuse this metric. A fan who re-enters a sponsor zone after seeing a key moment on the big screen is highly valuable, because the sport itself has re-anchored their attention. This is why live programming and site geometry must work together. The better you synchronize game flow with event layout, the more likely you are to create repeat visits and longer stays, which is the backbone of any strong audience growth strategy.
Translating Craft Revival and Wonders of Winter into Cricket Fan Zones
Craft Revival: value comes from proving the broader impact
The Craft Revival example from ActiveXchange is important because it shows that non-ticketed events can be measured not just by buzz, but by value creation. The insight that organizers can better determine tourism value through data gathering changes the conversation from “Was it busy?” to “What did it contribute to the local economy and community?” Cricket festivals should adopt the same logic, especially when they are held in partnership with councils, tourism agencies, or sponsors.
Imagine a city-based T20 festival with a free-entry fan village, artisan stalls, food trucks, cricket clinics, and regional showcases. Movement data can show how much of the crowd is local, how much is visiting from outside the area, and whether certain programming increases time spent in the precinct. That makes it easier to justify city support, attract sponsors, and expand the event in future years. It also provides a hard basis for decisions that would otherwise be judged by anecdote or pressure from the loudest stakeholder.
Wonders of Winter: growth comes from understanding audience journeys
ActiveXchange also points to the Wonders of Winter festival using movement data to better understand its audience and grow its reach every year. That’s a model cricket can borrow directly. Seasonal festivals often succeed because they are immersive, flexible, and designed around exploration. Cricket fan zones can do the same when they stop acting like static vendor villages and start acting like living experiences.
For a cricket event, “grow its reach” might mean extending the audience beyond core fans to families, youth groups, tourists, and casual passersby. It might also mean improving the ratio of first-time visitors to repeat visitors across the season. The key is to design for journey, not just arrival. To think about event storytelling in a comparable way, see revamping marketing narratives and how prestige events shape audience perception before anyone enters the venue.
Cricket’s version of a festival atmosphere
A cricket fan festival should combine sport, social energy, local food, sponsor experiences, and family-friendly activities into one coherent spatial story. That story fails when assets are placed randomly or copied from previous years without data. It succeeds when movement analytics tells you where people naturally congregate and where you need to guide them with visual anchors, screens, shade, and sound.
The best cricket activations feel effortless to attendees because the layout does the heavy lifting. The data work happens behind the scenes: corridor widths, vendor spacing, queue shaping, and staff rotations are all informed by how people actually behave. If you want a useful adjacent lens on spectacle and audience flow, major-event hospitality planning offers a strong parallel.
How to Design the Layout for Reach, Not Just Aesthetics
Start with “desire lines,” not sponsor wish lists
One of the most common event mistakes is designing from the sponsor deck outward instead of from visitor behavior inward. In practice, fans create natural paths, often called desire lines, based on entrances, screens, shade, toilets, food smells, and social opportunities. If you ignore those lines, you create dead zones that vendors hate and guests avoid.
The smarter approach is to map likely movement corridors before finalizing site design. Put premium, high-dwell assets where they can capture natural pauses. Place kids’ activities where families can settle without blocking the flow. Put high-margin vendors near transitions, not hidden in corners. This is the same kind of operational logic you’d use when studying predictive maintenance: fix the real bottlenecks before they become visible failures.
Use anchor points to distribute the crowd
Anchor points are features that pull people deeper into the site: a giant screen, a selfie installation, a live music set, a batting challenge, or a player appearance. If placed correctly, they break up congestion and spread demand across the precinct. If placed badly, they over-compress the crowd into a small area and reduce commercial opportunity elsewhere.
In cricket fan zones, the best anchor points often sit on the edges of busy areas rather than at their center. That creates a smoother spillover effect and increases movement past vendor lines. The result is broader exposure for sponsors and stronger sale opportunities for concessions. For teams thinking about the whole ecosystem, community reach should be a planning objective, not a side benefit.
Design for weather, shade, and time-of-day pressure
Movement patterns change dramatically with weather, sunlight, and match timing. A hot afternoon can push crowds toward shade and covered vendor clusters, while a night game can intensify the flow near bars, illuminated installations, and late-opening food stalls. If you don’t account for this, your layout might work at 2:00 p.m. and fail by 6:30 p.m.
That’s why the best layouts are dynamic, not fixed in mindset. They are designed with reconfiguration in mind: portable barriers, modular kiosks, flexible queue lanes, and staffable touchpoints that can be expanded or reduced based on live demand. This is exactly the kind of operational intelligence that makes data-informed decisions feel less risky and more repeatable.
Staffing Smarter: Match People to Peaks, Not Just Shifts
Use live density to predict service load
Staffing at non-ticketed cricket festivals should be based on anticipated density peaks, not on generic rosters. A zone with 200 people lingering for 30 minutes may require fewer staff than a 100-person zone that cycles rapidly through purchases and questions. The trick is to match team deployment to service intensity, not headcount alone. Movement analytics helps you predict where service demand will rise before queues start forming.
This matters especially in food and beverage zones, where queue length can kill conversion fast. If fans see a long line, they may simply choose another vendor or head back to the game. By contrast, a well-staffed vendor strip can absorb spikes and preserve the “easy, social, celebratory” feeling that drives spending. For event teams trying to sharpen commercial outcomes, staffing is one of the most direct levers for financial performance.
Move roaming staff to where hesitation is highest
Some staff should be fixed, but others should roam. Roaming ambassadors, information staff, and wayfinding teams are most effective when they are deployed to hesitation points: entrances, corridor splits, toilet approaches, underperforming zones, and family pressure points. These are the spots where people pause, look around, and decide whether to stay or leave.
In a cricket context, roaming staff can also nudge attendance into underutilized sponsor activations. If movement data shows a zone is being missed, staff can prompt visitors with short, clear invitations rather than generic announcements. This is a people-first extension of the same disciplined planning culture seen in broader venue and community operations work.
Build a staffing model for both peak and recovery
Many teams overstaff the initial rush and understaff the recovery period after a big innings, wicket, or break. But recovery periods are often when people buy food, visit activations, and linger in fan zones. If your team scales down too fast, you lose revenue during the very window where fans are emotionally primed to spend.
The answer is a two-speed staffing model: one layer for the baseline crowd and another for surge recovery. This is not unlike operational resilience planning in other industries, where systems need to handle both the incident and the rebound. For a useful analogy, see an operations crisis recovery playbook, which shows why response and recovery need to be planned together.
Vendor Optimization: Put the Right Product in the Right Path
Map vendors to intent, not just category
Vendor optimization is often treated as a simple mix problem: add food, add drinks, add merchandise, add entertainment. But movement data allows a much more specific approach. Different vendors suit different intent states. Fast snacks belong on high-turnover routes, premium meals belong near dwell zones, merchandise belongs where fans pause and celebrate, and sponsor-led giveaways belong at transition points where people are already changing direction.
That means vendor placement should follow audience behavior, not procurement convenience. The question is not “Where can we fit this stall?” but “What behavior do we want this stall to catch?” Once you ask that question, the entire event gets more efficient. This mindset lines up with broader discussions about commercial performance and how small design changes can create large financial outcomes.
Use data to reduce dead inventory and oversaturation
If two identical food vendors sit too close together, both may underperform because they split demand rather than expand it. The same problem appears when too many low-margin stalls are placed in low-traffic areas. Movement data helps you see oversaturation before it becomes a vendor complaint. It also helps you remove the guesswork from future tender decisions.
At scale, that means vendor selection becomes a strategic tool for audience growth. You can curate offerings that suit the expected demographic mix: families, students, sports tourists, and local regulars all spend differently. When you combine that insight with location data, you unlock a better match between offer and behavior. That’s one of the easiest ways to make a non-ticketed festival feel more premium without raising the entry barrier.
Build sponsor value around natural traffic, not forced exposure
Sponsors care about visibility, but visibility only matters if the audience is actually attentive. A brand wall in a dead zone may look impressive in photos and still generate low real-world engagement. A smaller activation in a high-flow choke point can outperform a much larger footprint elsewhere because it captures natural attention.
This is why movement analytics can improve sponsor renewal rates. It lets you demonstrate where the crowd actually interacted, how long they stayed, and what improved after design changes. If you want a parallel in brand logic, see why one clear promise beats a long feature list: clarity and placement usually matter more than volume.
How to Turn Movement Insights into a Real Growth Engine
Use a before-during-after planning cycle
The best events do not treat movement data as a post-event report. They use it in a cycle: before the event to shape layout, during the event to adjust staffing and wayfinding, and after the event to refine the next version. That cycle is what turns isolated activations into a growth engine. Without it, you’re only learning after the commercial window has closed.
Before the event, look at historical patterns and likely arrival waves. During the event, monitor congestion, underused zones, and conversion opportunities. After the event, compare the expected flow with the actual movement and isolate what caused success or friction. This iterative model mirrors the logic of statewide strategy built on evidence and helps cricket festivals become more than annual experiments.
Measure what local stakeholders actually care about
For councils, tourism partners, and venue owners, the most meaningful outcomes often extend beyond revenue. They want to know whether the event supported local businesses, increased footfall in the precinct, and delivered a community experience worth repeating. Movement data is ideal here because it translates crowd activity into place-based impact.
If you can show that a fan festival increased time spent in the local district, supported nearby hospitality, and encouraged visitors to explore beyond the main stadium entrance, you have a stronger case for future support. This is the same logic behind tourism value determination and broader community planning. It makes the event legible to funders, not just enjoyable to fans.
Build a culture of continuous improvement
Growth engines need internal buy-in. Event teams, commercial teams, operations teams, and stakeholders should all see movement data as a shared language rather than a specialist report no one reads. Once that happens, you stop arguing about opinions and start debating choices: Should we move the merch stand? Should we widen this walkway? Should we staff the food strip later? Those are the right arguments to have.
For teams that want to communicate these learnings clearly, data intelligence becomes as much about story as about measurement. Even small changes—moving a kids’ activation, adding shade, changing queue entry points—can produce outsize gains when applied consistently across a season. That’s the difference between a festival that feels busy and a festival that compounds value year after year.
Practical Playbook: How to Apply Movement Analytics in Your Next Cricket Festival
Step 1: Define the commercial and community goals
Start by deciding what success means. Is the goal more spend per head, longer dwell time, better sponsor interaction, stronger family attendance, or stronger tourism impact? You can’t optimize a fan festival if you don’t define the outcome. Good movement analytics is not about collecting more data; it’s about collecting the right data for the right decision.
Write down three to five KPIs and attach each one to a zone or experience. For example, the food lane might be judged on conversion and queue time, while the fan activation zone might be judged on dwell time and revisit rate. This makes the event manageable and prevents the planning team from drowning in “interesting” but unusable information.
Step 2: Map the site like a circulation system
Before finalizing the plan, draw the precinct as a circulation system rather than a flat diagram. Identify arrival points, pinch points, dwell zones, back-of-house access, and overflow areas. Then ask how a crowd would naturally move through the site if you removed all assumptions. That exercise alone often exposes the flaws in a design that looked fine in a presentation deck.
If the map shows too much pressure on one path, create relief by adding alternative attractions or breaking up the route with anchors. If it shows weak engagement in a wing of the site, introduce visual pull, better sightlines, or a staff-led activation. This is how you turn an event layout into a revenue tool instead of a logistics compromise.
Step 3: Review and re-allocate during the event
Do not wait until the end of the festival to react. If movement analytics reveals a zone is overloaded, add staff, simplify queue flow, or redirect people with live announcements. If a vendor row is underused, bring in roaming staff or shift a performer nearby to increase pull. The point is not perfection; the point is responsiveness.
Great event operators treat the site like a living system. They observe, respond, and re-balance the precinct in real time. That agility is the core value proposition of ActiveXchange in event operations: evidence that can be turned into action while the opportunity still exists.
| Planning Area | Common Gut-Feel Approach | Movement-Data Approach | Impact on Cricket Festivals |
|---|---|---|---|
| Layout | Place zones where they fit on the site map | Place zones where crowd flow naturally slows or clusters | Higher dwell time and better engagement |
| Staffing | Assign fixed shifts based on general attendance | Match staffing to peak density and recovery windows | Shorter queues and better service conversion |
| Vendor placement | Cluster stalls by category or convenience | Match vendor type to audience intent and traffic paths | Higher sales and fewer dead zones |
| Sponsor activations | Use large footprints for maximum visibility | Use high-flow touchpoints with clear conversion hooks | Better brand interaction and ROI |
| Community value | Measure success by attendance headline alone | Measure visitation, dwell, revisit, and precinct spillover | Stronger case for tourism and council support |
Pro Tip: In open-access cricket fan festivals, the most profitable zone is often not the biggest one. It is the one that captures a natural pause in movement and gives people a reason to stop, spend, and stay.
Common Mistakes to Avoid When Using Movement Data
Confusing traffic with value
Not all traffic is valuable, and not all high-traffic areas are profitable. A corridor can look busy while contributing almost nothing to vendor sales or sponsor engagement. Likewise, a quieter zone may be creating premium interactions or family satisfaction that matter more in the long run. The point is to interpret movement in context, not worship footfall on its own.
That’s why event teams should always connect movement patterns to commercial and experiential outcomes. A good dashboard should answer not just “How many?” but “So what?” When that becomes the operating norm, decision-making becomes sharper and less political.
Overdesigning the site and reducing flexibility
If every square meter is predetermined, your event will struggle to adapt to live conditions. Open-access cricket festivals need flexibility because weather, match flow, and audience mood change throughout the day. The better approach is modular design, where you can expand, shrink, or shift depending on what the data shows.
Think of your layout as a strategy, not a fixed artwork. The visual identity matters, but circulation, response, and conversion matter more. For teams looking to balance structure with adaptation, the lesson from late design modifications that enhanced customer experience is clear: small changes can deliver huge gains.
Ignoring the second-order effects
When you move a vendor, you don’t just change sales. You change walking distance, queue visibility, sound spill, and staff workload. When you add a stage, you don’t just add content. You change dwell patterns, congestion, and attention distribution. Good planning thinks in systems, not silos.
This is why movement analytics is so powerful in event operations and venue experience. It forces teams to see the ripple effect of every decision. Once you adopt that mindset, your cricket fan festival becomes easier to manage and more valuable to everyone involved.
Conclusion: From Festival Day to Growth Strategy
Non-ticketed cricket festivals can either be loose, hard-to-measure add-ons or disciplined growth engines that expand fan reach, strengthen community ties, and improve commercial returns. The difference is movement data. By studying how people actually move through the site, you can design better layouts, staff smarter, place vendors more effectively, and build sponsor value that reflects real attention rather than assumed exposure. That is the path from “busy event” to “repeatable asset.”
The Craft Revival and Wonders of Winter examples show what’s possible when organizers use movement analytics to prove value, understand audience journeys, and guide future growth. Cricket fan zones should follow the same model, especially if they want to compete for attention in a crowded live-entertainment market. If you’re shaping your next event strategy, use the same evidence-led mindset that underpins modern sports planning, then keep refining it through every activation.
For more event and audience planning insight, revisit ActiveXchange success stories, compare approaches with major-event hospitality planning, and think about how the wider ecosystem—from community reach to financial performance—can be improved by better data.
FAQ: Movement Data for Cricket Fan Festivals
1. What is movement analytics in a cricket festival context?
It is the process of measuring how attendees enter, circulate, dwell, and exit within a non-ticketed fan zone or festival precinct. The goal is to understand crowd behavior well enough to improve layout, staffing, vendor placement, and sponsor return.
2. Why is movement analytics especially useful for non-ticketed events?
Because non-ticketed events are open systems with less predictable behavior than gated events. Movement analytics gives organizers a way to see which areas attract attention, which areas underperform, and where changes can increase conversion and comfort.
3. How does it help with vendor optimization?
It shows where different vendor types are most likely to succeed based on traffic patterns and audience intent. Fast food can go near high-flow routes, while premium or experiential vendors can be placed near dwell zones or anchor attractions.
4. Can movement data improve sponsor ROI?
Yes. It helps sponsors get placed where real attention exists, not just where there is empty space. It also creates measurable evidence of engagement, revisit behavior, and footfall around brand activations.
5. How do Craft Revival and Wonders of Winter relate to cricket festivals?
They show how data can prove the value of non-ticketed events and help organizers understand audience journeys. Cricket fan festivals can use the same approach to grow tourism impact, improve site design, and build stronger year-on-year performance.
6. What’s the first step for a venue team starting with movement data?
Define the event goals first, then map the site’s circulation paths and key zones. After that, use the data to inform staffing, vendor placement, and live event adjustments so the precinct can respond to actual behavior.
Related Reading
- Success Stories | Testimonials and case studies - ActiveXchange - See how evidence-based planning is already changing sports and recreation decisions.
- Hot Sports Trends: Where to Watch and Eat for Major Events - A useful companion for understanding how fans choose social spaces around big fixtures.
- How AI-Powered Predictive Maintenance Is Reshaping High-Stakes Infrastructure Markets - A strong analogy for spotting bottlenecks before they become operational failures.
- Revamping Marketing Narratives: Lessons from the Oscars - Learn how premium events shape perception and audience attention.
- Why One Clear Solar Promise Outperforms a Long List of Features - A sharp reminder that clarity and focus beat clutter in any experience design.